Delve into the comprehensive crime statistics of the UK, revealing insights into areas where safety and tranquillity are particularly paramount. This exploration not only sheds light on areas with heightened crime rates but also underscores the importance of community safety initiatives and law enforcement efforts nationwide.
1. Cleveland, Yorkshire

Tops with a crime rate of 139.6 per 1,000 people, notable for high instances of sexual offences and violence.
2. West Yorkshire

Followed by a crime rate of 132.9 per 1,000 people, with violence and theft among its primary concerns.
3. Merseyside
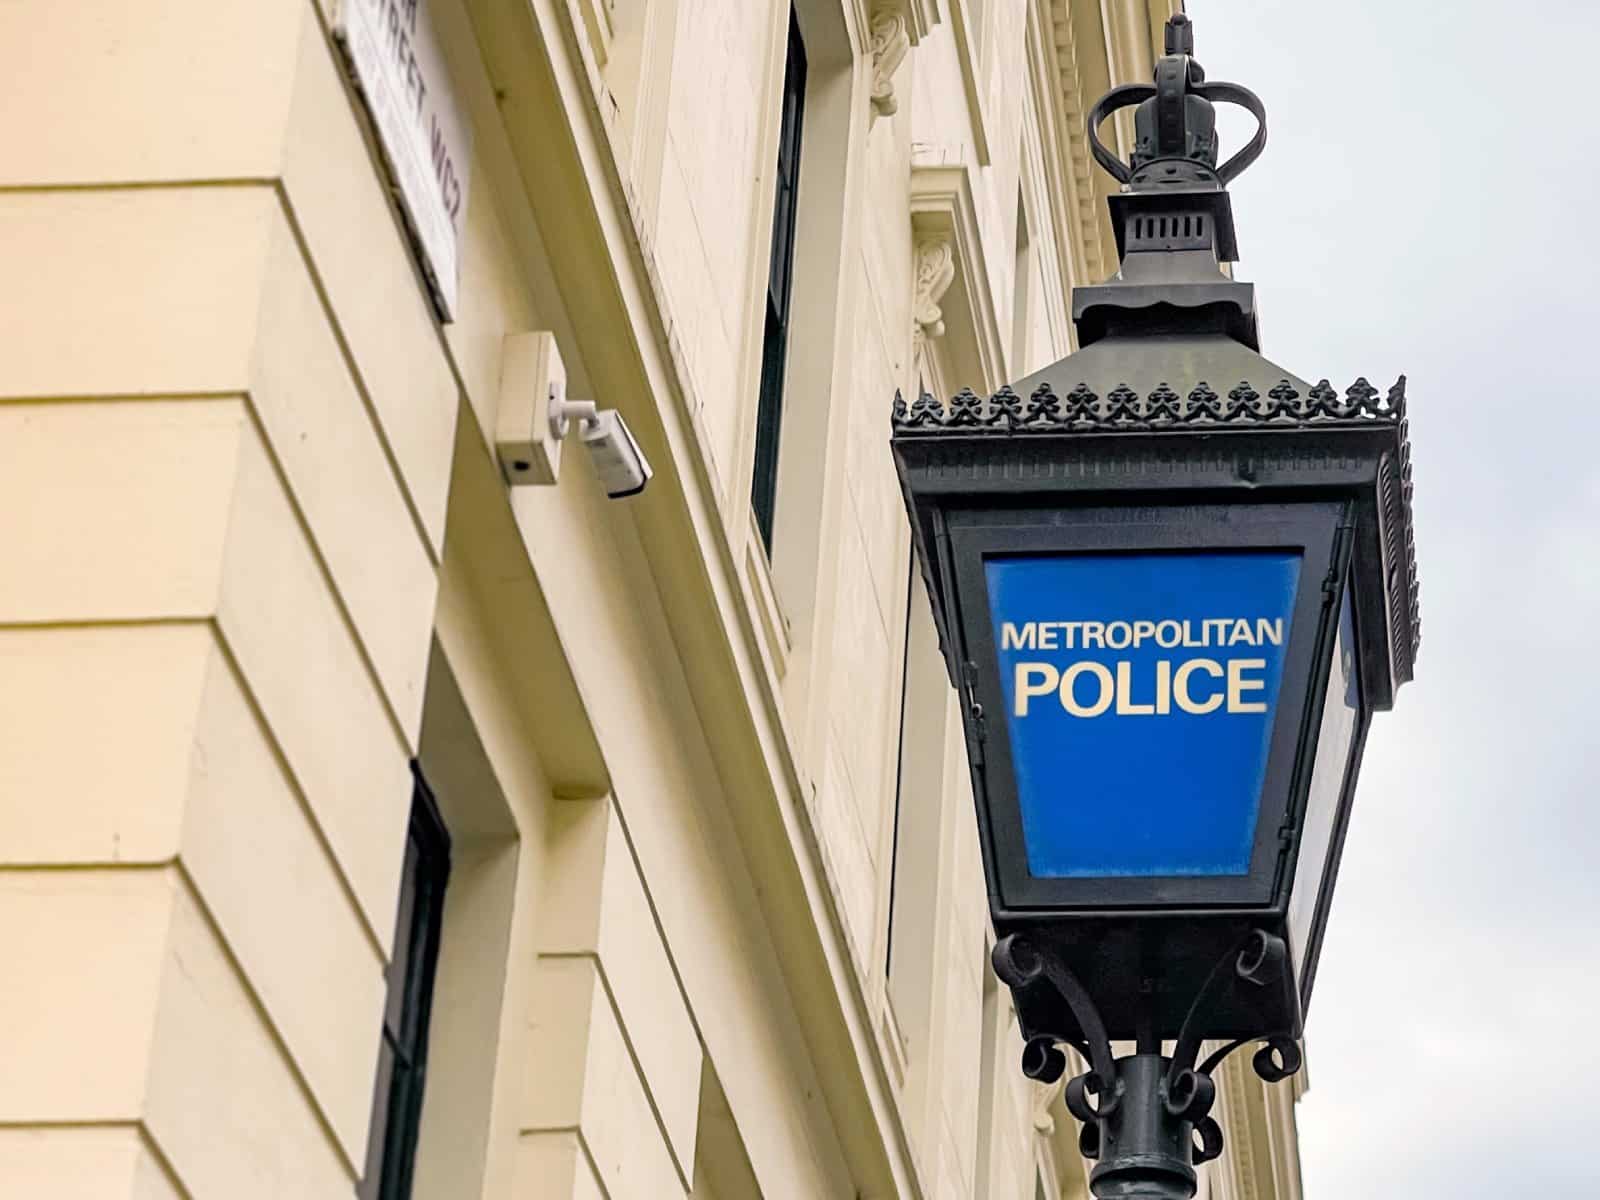
Reports a total crime rate of 120.2 per 1,000 people, standing out for the country’s highest drug crime rate.
4. Greater Manchester

Faces a total crime rate of 128.5 per 1,000 people, with significant issues around sexual violence and theft.
5. West Midlands

Exhibits a crime rate of 126.4 per 1,000 people, with notable rates of violence and vehicle crimes.
6. Barking & Dagenham, London

Sees a crime rate of 120.6 per 1,000 people, with violence and theft as chief concerns.
7. Newham, London

Has a crime rate of 120.9 per 1,000 people, troubled by high theft rates including shoplifting.
8. Lambeth, London

Posts a crime rate of 122.2 per 1,000 people, with theft and violent crime as main issues.
9. Tower Hamlets, London

Records a crime rate of 124.1 per 1,000 people, with rising theft and violent crimes.
10. Hackney, London

Reports a crime rate of 126.3 per 1,000 people, with significant theft, including bicycle thefts, and violent crimes.
11. Haringey, London

Notes a crime rate of 127.3 per 1,000 people, with violent crime and theft leading the statistics.
12. Islington, London

Has a crime rate of 129.2 per 1,000 people, with high rates of theft and violent crime.
13. Southwark, London

Faces a crime rate of 129.9 per 1,000 people, with theft constituting a major part of the crime figures.
14. Hammersmith & Fulham, London

Shows a crime rate of 137.6 per 1,000 people, with theft and violent crime as significant issues.
15. Camden, London
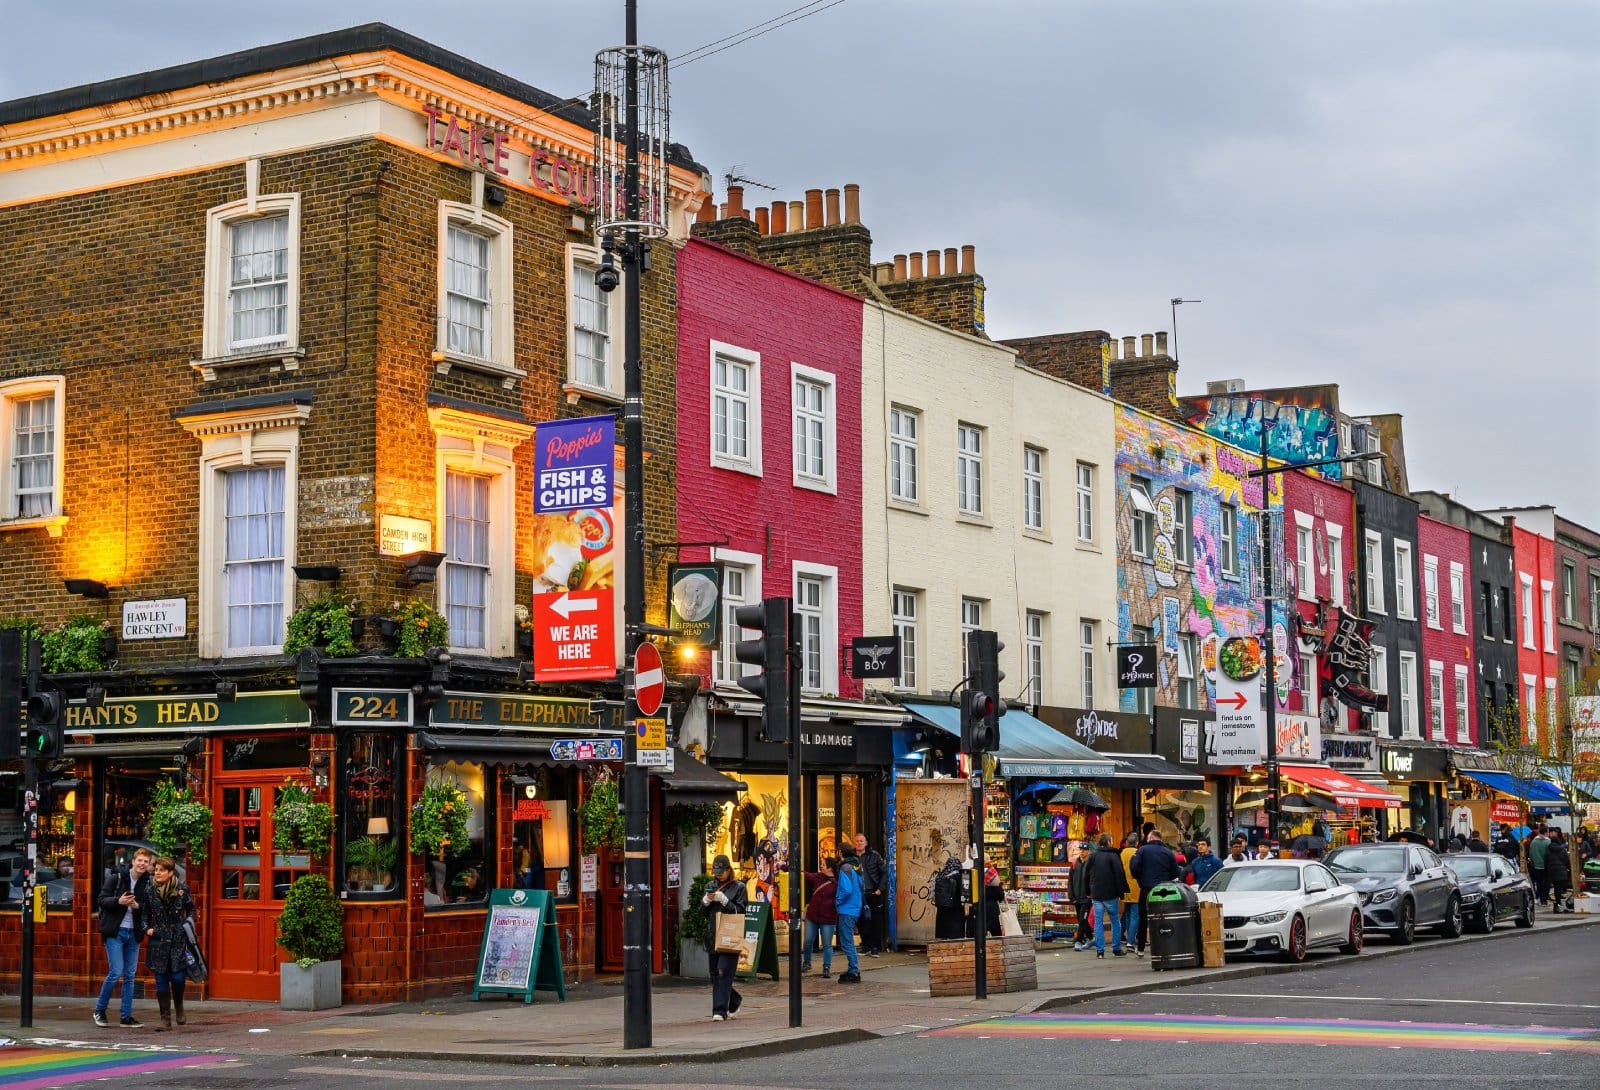
Marks a high with an overall crime rate of 153.7 per 1,000 people, primarily troubled by theft and violent crime.
These figures highlight the pressing need for community and police collaboration to address and mitigate crime, enhancing safety and well-being across the UK’s diverse communities.
The post UK’s Danger Zones: 15 Places You Should Know About first appeared on All Things Buzz.
Featured Image Credit: Shutterstock / Fabio Principe.
For transparency, this content was partly developed with AI assistance and carefully curated by an experienced editor to be informative and ensure accuracy.

